

Using the screener
Reading stock cards and list items
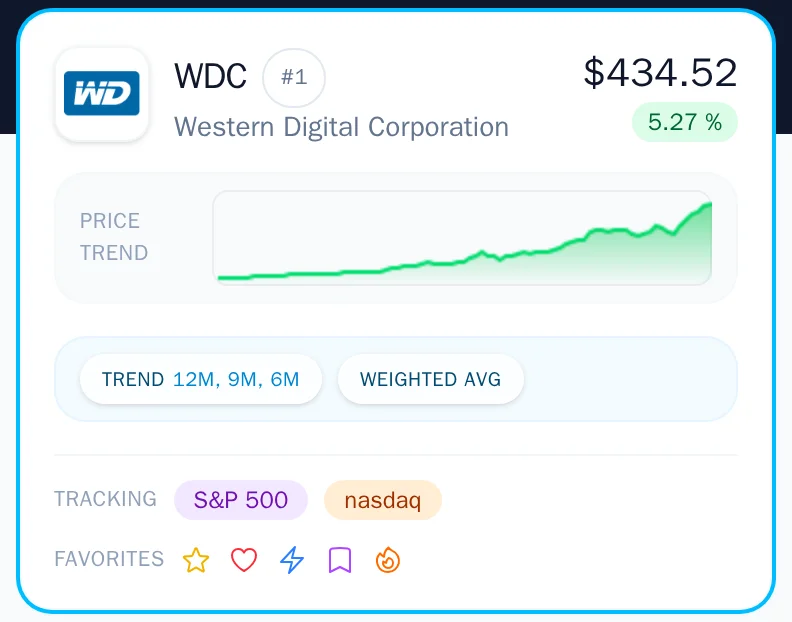
Each stock in your momentum table is displayed as a card containing key information at a glance. This guide explains every element so you can quickly interpret what you see.
Card anatomy
A stock card contains several sections, each providing different insights:
Ticker and company name
- Ticker symbol – The bold stock symbol (e.g., AAPL, NVDA)
- Company name – The full company name appears below the ticker
- Company logo – When available, the company's logo displays to the left of the ticker
Position number
The number to the right of the stock ticker (1, 2, 3, etc.) shows the stock's position in your current filtered and sorted list. This is the display order, not the momentum rank itself.
Price information
- Current price – The most recent closing price
- Daily change – Shown as a percentage, color-coded:
- Green – Positive change (stock went up)
- Red – Negative change (stock went down)
- Gray – No change or data unavailable
Mini price chart
The small chart on each card shows the price history over 1 year:
- Green line – The most recent day's change was positive
- Red line – The most recent day's change was negative
This gives you a quick visual of recent momentum without opening the full chart.
Qualifier badges
Qualifier badges show which enabled momentum categories a stock ranks in (based on your current count setting):
Trend qualifiers
When you see labels like 12M, 9M, 6M, 3M under "Trend":
- The stock ranks in the top N for that momentum timeframe
- Multiple labels mean the stock qualifies across several timeframes
- This indicates broad momentum strength
Weighted Average qualifier
A stock showing the weighted average qualifier (w. avg) has strong combined momentum across all timeframes, with emphasis on recent performance.
Volatility details
Volatility is no longer shown as a card qualifier. Use the Volatility stats view to compare the selected stock's maximum drawdown across five trailing windows and optionally shade a drawdown span on the chart.
Tracking and watchlist badges
Tracking badges
Special system badges indicate index membership or analyst tracking:
| Badge | Meaning |
|---|---|
| MS+ | On the Momentum Screener analysts' watchlist |
| S&P 500 | Member of the S&P 500 index |
| NASDAQ | Member of the NASDAQ-100 |
| DJI | Member of the Dow Jones Industrial Average |
| MAG 7 | One of the "Magnificent Seven" mega-cap tech stocks |
These badges help you quickly identify stocks with special characteristics.
- The MS+ watchlist is provided for informational purposes only and does not constitute investment advice
Watchlist badges
Colored badges appear when a stock is in one of your watchlists:
- Each badge matches the color and icon you assigned to that watchlist
- Stocks can have multiple badges if they belong to several lists
- Hover over a badge to quickly see the name of the list it represents
Card states
Selected state
When you click a stock:
- The card highlights with a distinct border color
- The main chart area loads that stock's detailed chart
- The supplemental stats area loads that stock's tracking badges, watchlist buttons, and fundamentals data
- On mobile, the card expands to show the detailed chart and fundamentals information
- The expanded mobile chart includes controls to navigate through the list without needing to close and reopen the card for each stock
Search result indicator
When viewing search results, cards show a search icon in the top-left corner indicating they came from a search rather than your filtered list.
Delisted indicator
Stocks that have been delisted show a special badge. These remain visible if they are in your watchlists but will not appear in normal filtered results.
Compact view
Toggle compact view (grid icon above the list) to:
- See more stocks at once
- Display smaller cards with essential information only
- Useful for quickly scanning a large list
In compact view, you still see:
- Ticker, company name, and logo
- Price and change percentage
- Watchlist and tracking badges
Interacting with cards
Click/tap to select
Clicking a card:
- Selects it (highlights the card)
- Loads the full chart in the main chart area
- On mobile, expands to show additional details
Adding to watchlists
When a card is selected, all your watchlists appear as toggle buttons:
- Dimmed – The stock is not in that list
- Highlighted – The stock is in that list
Tap any button to toggle the stock in or out of that list. Changes save instantly and badges update immediately on the card.
Keyboard navigation
| Shortcut | Action |
|---|---|
| N | Move to next stock |
| M | Move to previous stock |
| A | Toggle adjusted prices in the chart |
| 1 | Toggle watchlist #1 for selected stock |
| 2 | Toggle watchlist #2 for selected stock |
| 3 | Toggle watchlist #3 (and so on...) |
Keyboard shortcuts can be customized in Settings → Keyboard shortcuts.
What the numbers mean
Understanding list position
The number next to each stock (1, 2, 3...) shows its position in your current filtered and sorted list. This is a relative ranking within your active view, not an absolute market-wide rank.
We intentionally display relative position rather than raw ranking values. With roughly 50,000 securities in the database, absolute rank numbers can be confusing or misleading—a stock ranked #847 out of 50,000 is excellent, but the number alone doesn't convey that. By showing position within your filtered results, you always know exactly where a stock stands relative to the others you're evaluating.
Reading change percentages
The percentage change shown is the daily change from the previous close:
- +2.45% – Stock gained 2.45% during the last market day
- -1.20% – Stock lost 1.20% during the last market day
For longer-term performance, check the full chart or the momentum rankings themselves.
Tips for efficient scanning
- Watch for multiple trend qualifiers – Stocks ranking across several timeframes often have the strongest momentum.
- Check the Volatility view if you prefer smoother rides – Compare maximum drawdowns across five trailing windows.
- Use watchlist badges to instantly spot your tracked positions as you scroll.
- Save compact view for familiar lists – It hides the price chart and qualifiers, so it works best when you already know the stocks (like scanning a watchlist) or when screen space is tight.
Customize your view
Between compact/full view, filter combinations, and sort options, you can set up the table exactly how you like to work. Experiment to find your ideal workflow.